


Navigation

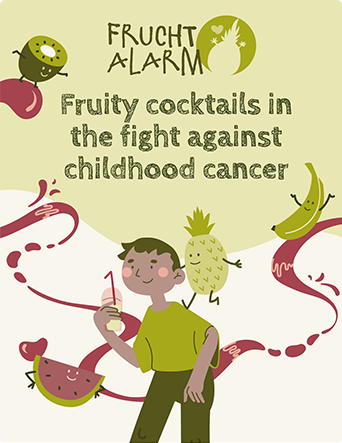
To mark World Blood Cancer Day on 28 May, this month’s infographic is devoted to a very special initiative by the name of ‘Fruchtalarm’; together with this initiative, our team have produced an infographic that illustrates its work and the idea behind it.
Fruchtalarm is a mobile cocktail bar for children with cancer in Germany. Once a week, it visits 36 different children’s cancer wards, rehabilitation care clinics and children’s hospices all over the country, giving the children and young people a chance to mix fruit cocktails from a variety of juices, nectars and squashes. The aim is to encourage them to drink fluids in a fun and active way.
The concept of Fruchtalarm promotes independence and love of life, thereby offering a break from the routine of hospital life for the severely ill children and young people.

Authors: Sarah Tebbe, Melanie Schulz
Graphic: Maxi Ringleb
Date: 24.05.2023
Unser Mehrwert
Individuelles Informationsdesign – direkt vom Experten für Datenrecherche
Wir von Statista Content & Information Design beschäftigen uns seit Jahren mit Daten, Fakten und Analysen. Daher verstehen wir besonders gut, wie diese visuell aufbereitet werden können. Zudem umfasst das Portal von Statista mehr als eine Million Statistiken, Studien und Reports aus über 22.500 Quellen – die ideale Grundlage für ein spannendes Data Storytelling nach Maß.
Unsere Produkte
Entdecken Sie unsere Produkte für Ihre individuelle Datenvisualisierung
What are the central success factors and challenges in digital content marketing and the most popular tactics employed by companies?
Every year, we survey the German-speaking content marketing community in tandem with the Content Marketing Forum e.V. and CMCX and provide valuable insights and benchmarks in our 2023 Content Marketing Trend Study.
Marketing officers from a wide variety of sectors answer questions about their content marketing strategy, key success factors and significant technologies and trends.
In this month’s infographic, we have summarised four key findings for you:
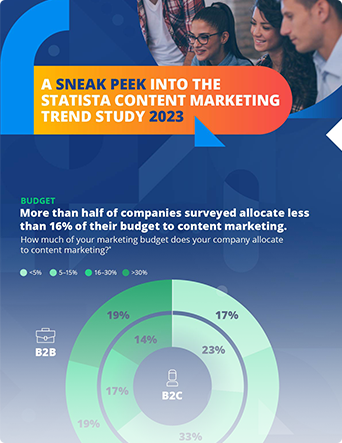
More than half of the companies surveyed allocate less than 16% of their budget to content marketing.
52% of B2B companies earmark 0–15% of their budget for content marketing. In the B2C segment, this figure rises to 56% of companies.
Instagram and Facebook are neck and neck in the B2C sector – in B2B companies, LinkedIn is still ahead.
While Facebook still held a lead of 9 percentage points over its sister platform Instagram in 2022, the two sites now share first place as the most-used social media channels in the B2C segment. LinkedIn has further strengthened its dominant position in B2B.
B2B companies need better ideas and themes, B2C companies want more budget.
42% of B2B marketing professionals feel that better ideas and themes would make their content marketing more successful. In B2C, 50% regard more budget as the key to greater success.
AI tools are more important for B2C companies.
53% of B2C marketers view the use of AI-based tools as important/very important for their company. This view was only shared by 28% of B2B marketing professionals.
Curious?
Then download the entire study free of charge to discover even more content marketing trends.

Author: Nicole Turkin
Graphic: Jörg Huylebrouck
Date: 25.04.2023
Information about current topics and trends as well as free infographics every month in our newsletter!
OUR VALUE ADDED
Individual information design – directly from the expert for data research
We at Statista Content & Information Design have been dealing with data, facts and analyses for years. Therefore we understand particularly well how these can be presented visually. Also, Statista’s portal comprises more than one million statistics, studies and reports from over 22,500 sources – the ideal basis for exciting, customized data storytelling.
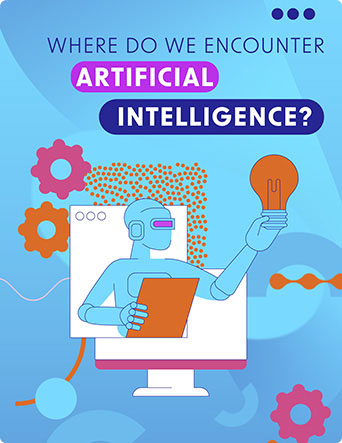
Artificial intelligence (AI) describes the reproduction and automation of intelligent human behaviours. AI is used in a wealth of areas, such as the development of virtual assistants, industrial robots and in the healthcare sector.
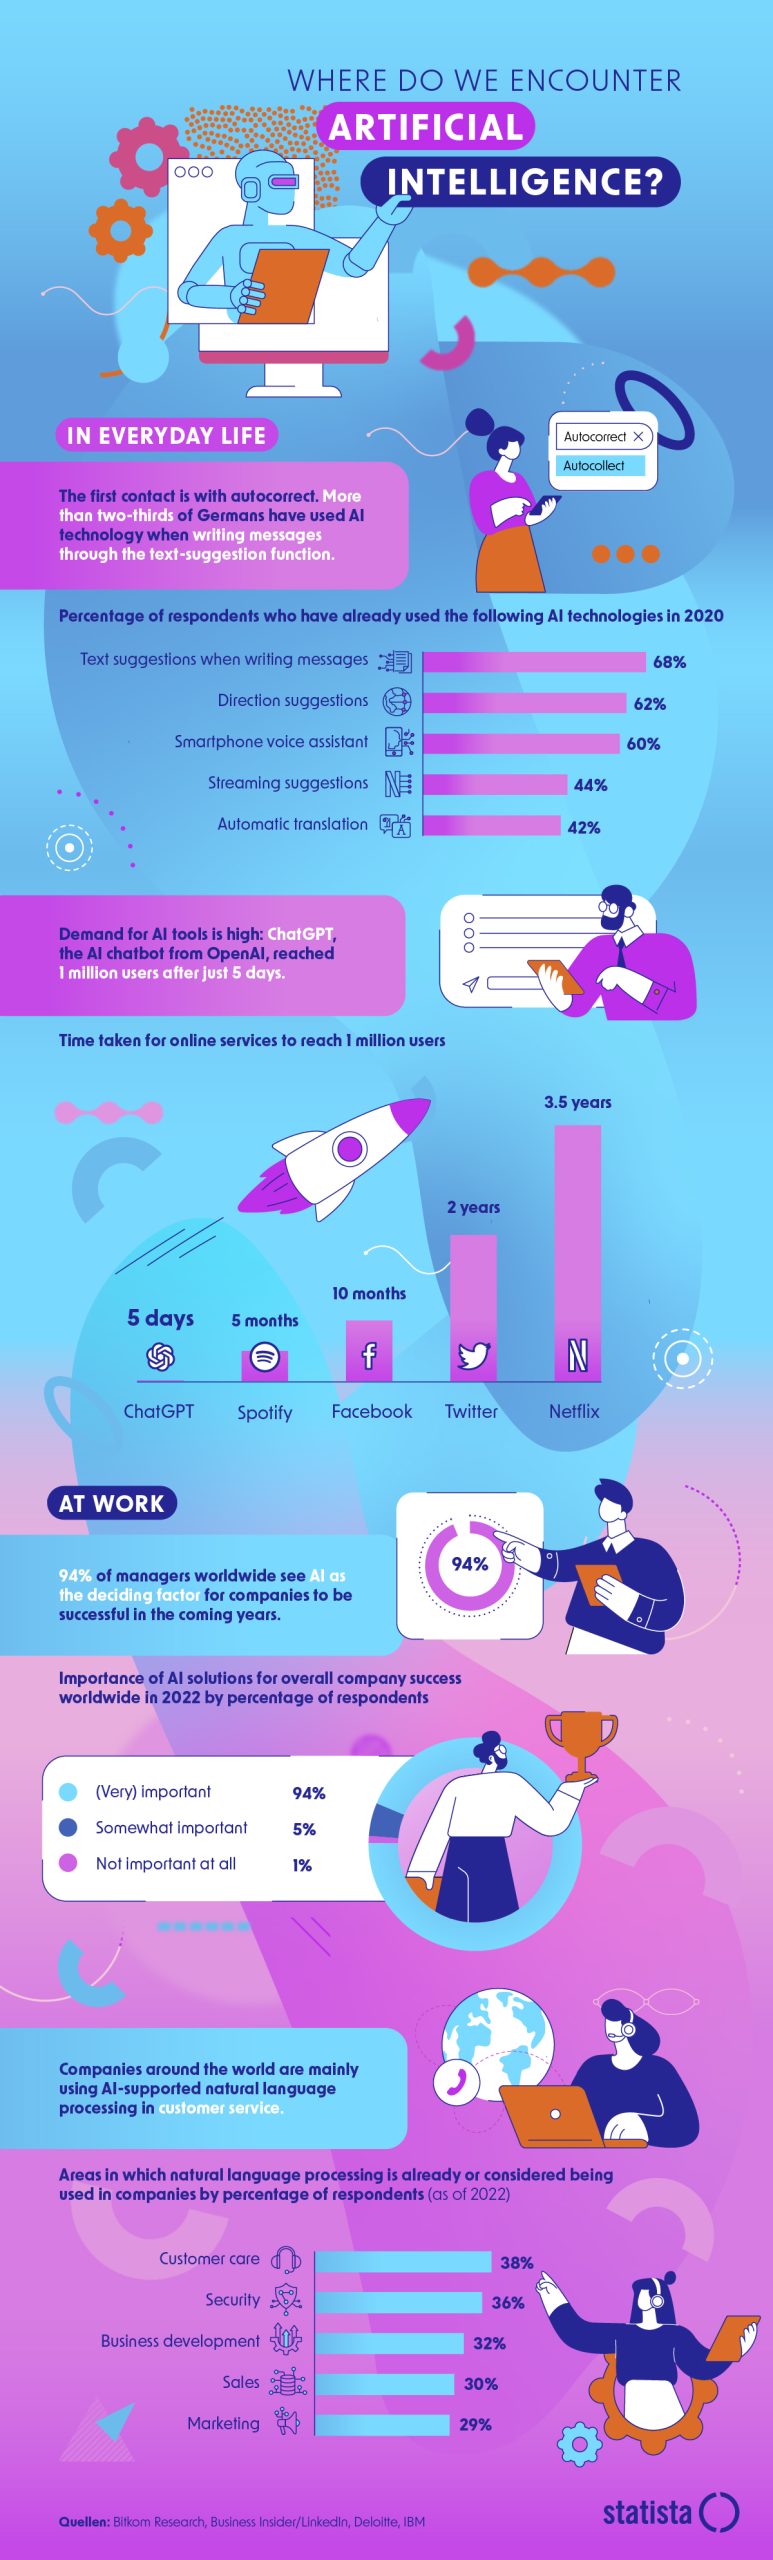
First contact via AutoCorrect
More than two thirds of people in Germany have encountered AI technology in the form of suggested words when typing messages on their smartphone. You will probably also be familiar with the following everyday applications of AI technology:
AI can now also handle content
The topic of artificial intelligence became omnipresent in the media when the AI chatbot ChatGPT was released in November 2022. There are now a host of AI-based tools that enable text and image generation based on text commands. These fall within the category of generative AI.
This represents a form of AI technology that draws on data and information gathered online to independently generate text, images and/or multimedia content. This technology is based on a form of machine learning in which algorithms are trained using huge quantities of data in order to detect specific connections and apply them to unfamiliar data.
AI = future success factor
In the world of work, AI can be used to automate repetitive tasks and processes and thus boost productivity. Furthermore, AI can help to analyse data more quickly and gain insights into patterns and trends. Therefore, 94% of executives worldwide regard AI as a key success factor in business in the years ahead.
Do you also want to try out the possibilities of AI?
With the AI copywriter from our partner neuroflash, you can create a variety of different text formats, such as blog posts, social media posts, and newsletters, or rewrite existing wording in just a few seconds.
Get 2000 words for free every month – no credit card required. Let the AI tool create text or images according to your instructions.
Author: Nicole Turkin
Graphic: Raphael Hammer
Date: 21.03.2023
Information about current topics and trends as well as free infographics every month in our newsletter!
OUR VALUE ADDED
Individual information design – directly from the expert for data research
We at Statista Content & Information Design have been dealing with data, facts and analyses for years. Therefore we understand particularly well how these can be presented visually. Also, Statista’s portal comprises more than one million statistics, studies and reports from over 22,500 sources – the ideal basis for exciting, customized data storytelling.
It’s a match: online dating remains popular. Which are the world’s favourite dating apps? Which age group accounts for the most users? To celebrate Valentine’s Day, we have compiled fascinating facts and usage figures on the topic of dating apps. Check out our infographic to find out more about online dating.

Author: Nicole Turkin
Graphic: Sandy Geist
Date: 14.02.2023
Information about current topics and trends as well as free infographics every month in our newsletter!
OUR VALUE ADDED
Individual information design – directly from the expert for data research
We at Statista Content & Information Design have been dealing with data, facts and analyses for years. Therefore we understand particularly well how these can be presented visually. Also, Statista’s portal comprises more than one million statistics, studies and reports from over 22,500 sources – the ideal basis for exciting, customized data storytelling.
We use online platforms to shop, book holidays, conclude agreements … and share a good deal of personal data in the process. This raises the question of how safe this data is.
66% of Internet users worldwide are worried about their identity being stolen. This month’s infographic, however, reveals that actual user habits do not always reflect these concerns about data security.

Author: Nicole Turkin
Graphic: Angela Paola Santos Sitges
Date: 17.01.2023
Information about current topics and trends as well as free infographics every month in our newsletter!
OUR VALUE ADDED
Individual information design – directly from the expert for data research
We at Statista Content & Information Design have been dealing with data, facts and analyses for years. Therefore we understand particularly well how these can be presented visually. Also, Statista’s portal comprises more than one million statistics, studies and reports from over 22,500 sources – the ideal basis for exciting, customized data storytelling.
In just a few days, an eventful and challenging year will draw to a close. As our news apps, social networks and inboxes were so often inundated with negative headlines, our final infographic in 2022 focuses on the curious, positive and hopeful stories that emerged this year. Are you ready to look back on the year from a slightly different angle?
The Statista Content & Design team wishes you a merry Christmas and a happy and successful new year!

Author: Nicole Turkin
Graphic: Monika Gnosdorf
Date: 13.12.22
Information about current topics and trends as well as free infographics every month in our newsletter!
OUR VALUE ADDED
Individual information design – directly from the expert for data research
We at Statista Content & Information Design have been dealing with data, facts and analyses for years. Therefore we understand particularly well how these can be presented visually. Also, Statista’s portal comprises more than one million statistics, studies and reports from over 22,500 sources – the ideal basis for exciting, customized data storytelling.
More and more people are adopting a plant-based diet – a trend that is also reflected in food retail. Discover fascinating statistics about vegan food in this month’s infographic.

Author: Nicole Turkin
Graphic: Isabell Küpper
Date: 17.11.22
Information about current topics and trends as well as free infographics every month in our newsletter!
OUR VALUE ADDED
Individual information design – directly from the expert for data research
We at Statista Content & Information Design have been dealing with data, facts and analyses for years. Therefore we understand particularly well how these can be presented visually. Also, Statista’s portal comprises more than one million statistics, studies and reports from over 22,500 sources – the ideal basis for exciting, customized data storytelling.
Influencer marketing is a key component in the marketing strategy of many companies across different sectors. And rightly so: did you know, for example, that more than half of German followers have already bought at least one product due to an influencer recommendation? Here is a summary of important study insights on the topic of influencer marketing:
Influencers are playing an ever greater role in the global advertising market.
The reach of influencers is growing continuously, as shown by a Statista Advertising & Media Outlook forecast for the United States and Germany. With 323 million social media users reached, this reach is more than four times as high in the US than in Germany. However, the reach of influencers in Germany is growing much more rapidly; in the period between 2018 and 2026, it will have increased by an estimated 54 per cent. In the US, on the other hand, the growth rate is a mere 20 per cent.
Influencer marketing reaches different age groups.
It’s not only teenagers and young adults who follow influencers: 57 per cent of 30- to 49-year-old social media users in Germany follow influencer content. The older people are, the less likely they are to follow. Nevertheless, as of July 2022, 21 per cent of the users aged 65 or above still follow influencers.
Influencer marketing has an impact on purchase decisions.
The extent to which influencers can influence purchase decisions is reflected in the number of digital users in Germany who have purchased products and services due to social media content: according to a 2021 special influencer marketing report by the German association of Online Research (agof) and Kölnmesse, more than half of influencer followers, 50.7 percent, have already done at least once. In particular, women and 16- to 39-year-olds are particularly likely to be encouraged to buy.
Influencer marketing is relevant across sectors.
Influencer marketing should not be solely associated with retail and the media sector. In 2020, many sectors invested far more resources in influencer marketing than in the previous year. In a study carried out by market research company TAKUMI, more than 50 per cent of marketers in Germany, the UK and the US from the following sectors agreed with the statement above:
Author: Nicole Turkin
Video: Raphael Hammer
Date: 20.10.22
Information about current topics and trends as well as free infographics every month in our newsletter!
Our Value Added
Individual information design – directly from the expert for data research
We at Statista Content & Information Design have been dealing with data, facts and analyses for years. Therefore we understand particularly well how these can be presented visually. Also, Statista’s portal comprises more than one million statistics, studies and reports from over 22,500 sources – the ideal basis for exciting, customized data storytelling.
Our Products
Discover our products for your individual data visualization
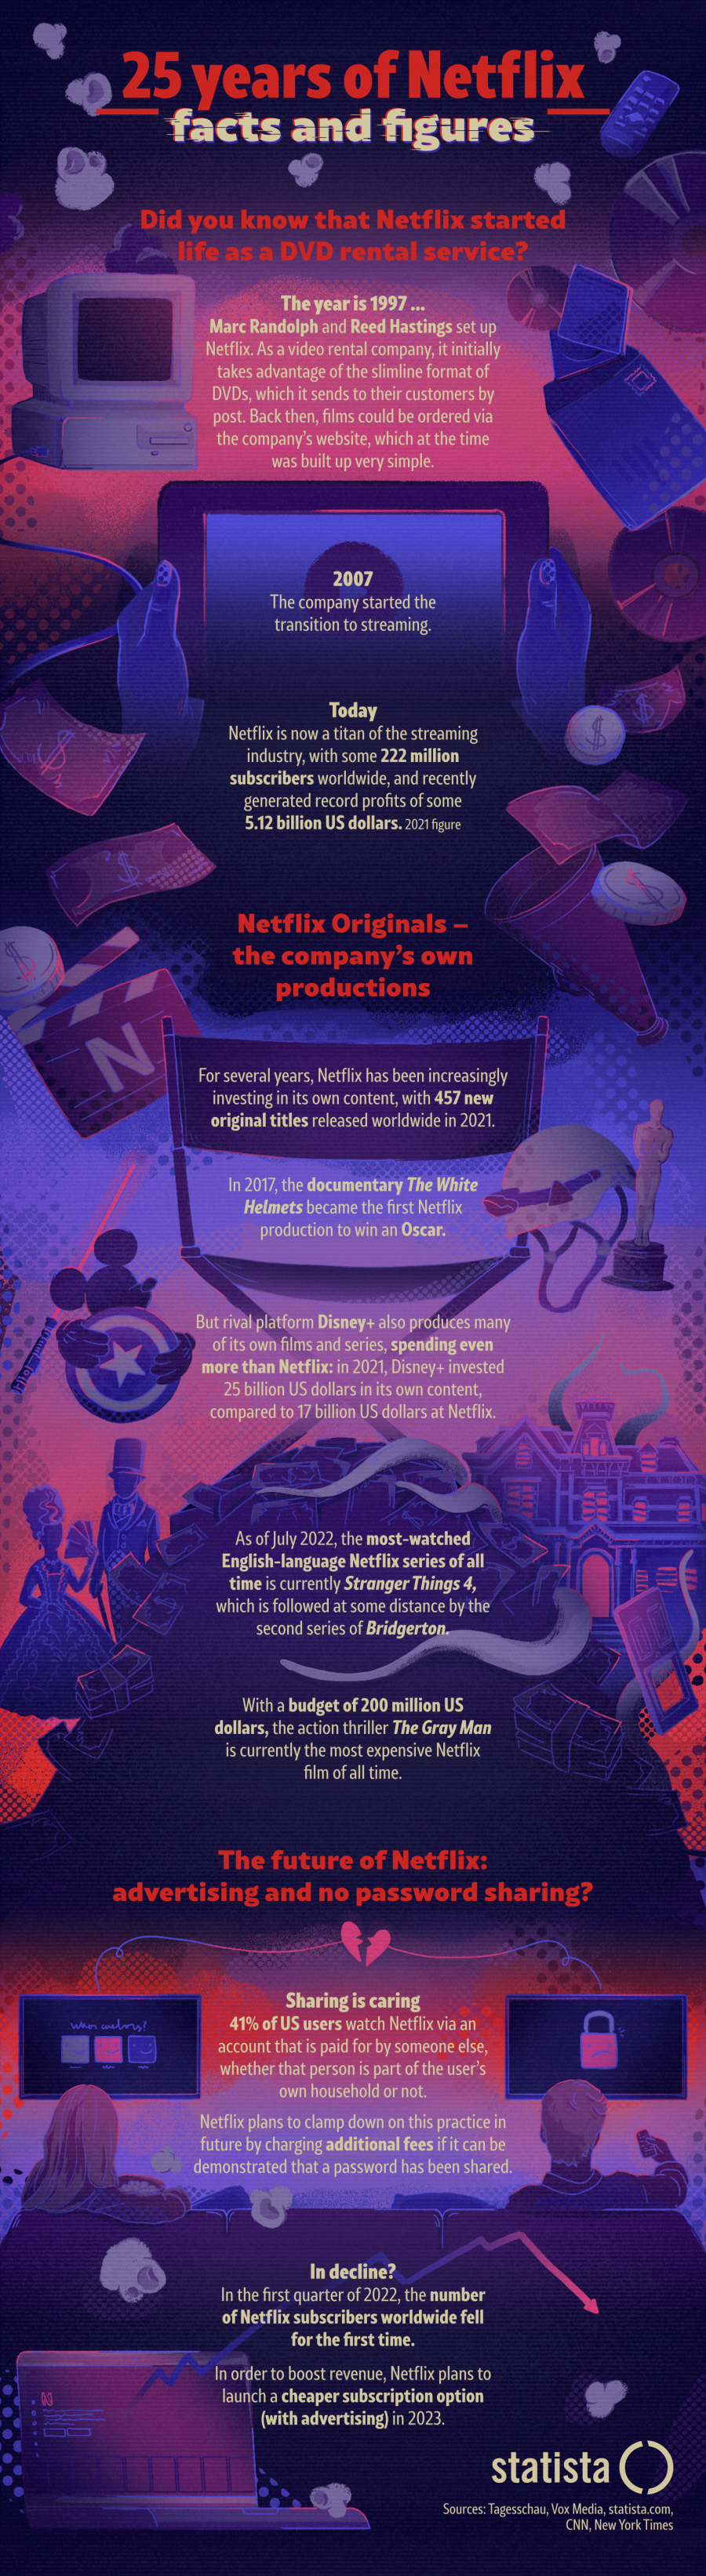
Perhaps you’ve already watched something on Netflix today? The company recently celebrated its 25th anniversary. The streaming platform is part and parcel of our daily lives, not to mention our pop culture. This month’s infographic is full of surprising facts and figures about Netflix.
Author: Nicole Turkin
Graphic: Maxi Ringleb
Date: 20.09.22
Information about current topics and trends as well as free infographics every month in our newsletter!
OUR VALUE ADDED
Individual information design – directly from the expert for data research
We at Statista Content & Information Design have been dealing with data, facts and analyses for years. Therefore we understand particularly well how these can be presented visually. Also, Statista’s portal comprises more than one million statistics, studies and reports from over 22,500 sources – the ideal basis for exciting, customized data storytelling.
Author: Nicole Turkin
Graphic: Katja Schönemann
Datum: 15.08.22
Heatwaves, flooding, heavy rain – the impact of climate change can already be felt around the world. We are facing existential challenges that will fundamentally change our way of life. But what solutions are out there in terms of adapting to climate change? In this month’s featured infographic, we present some innovative approaches.

Information about current topics and trends as well as free infographics every month in our newsletter!
OUR VALUE ADDED
Individual information design – directly from the expert for data research
We at Statista Content & Information Design have been dealing with data, facts and analyses for years. Therefore we understand particularly well how these can be presented visually. Also, Statista’s portal comprises more than one million statistics, studies and reports from over 22,500 sources – the ideal basis for exciting, customized data storytelling.
You need to load content from reCAPTCHA to submit the form. Please note that doing so will share data with third-party providers.
More Information