Author: Gabriela Hein
Graphic: Jörg Huylebrouck
Datum: 14.06.22
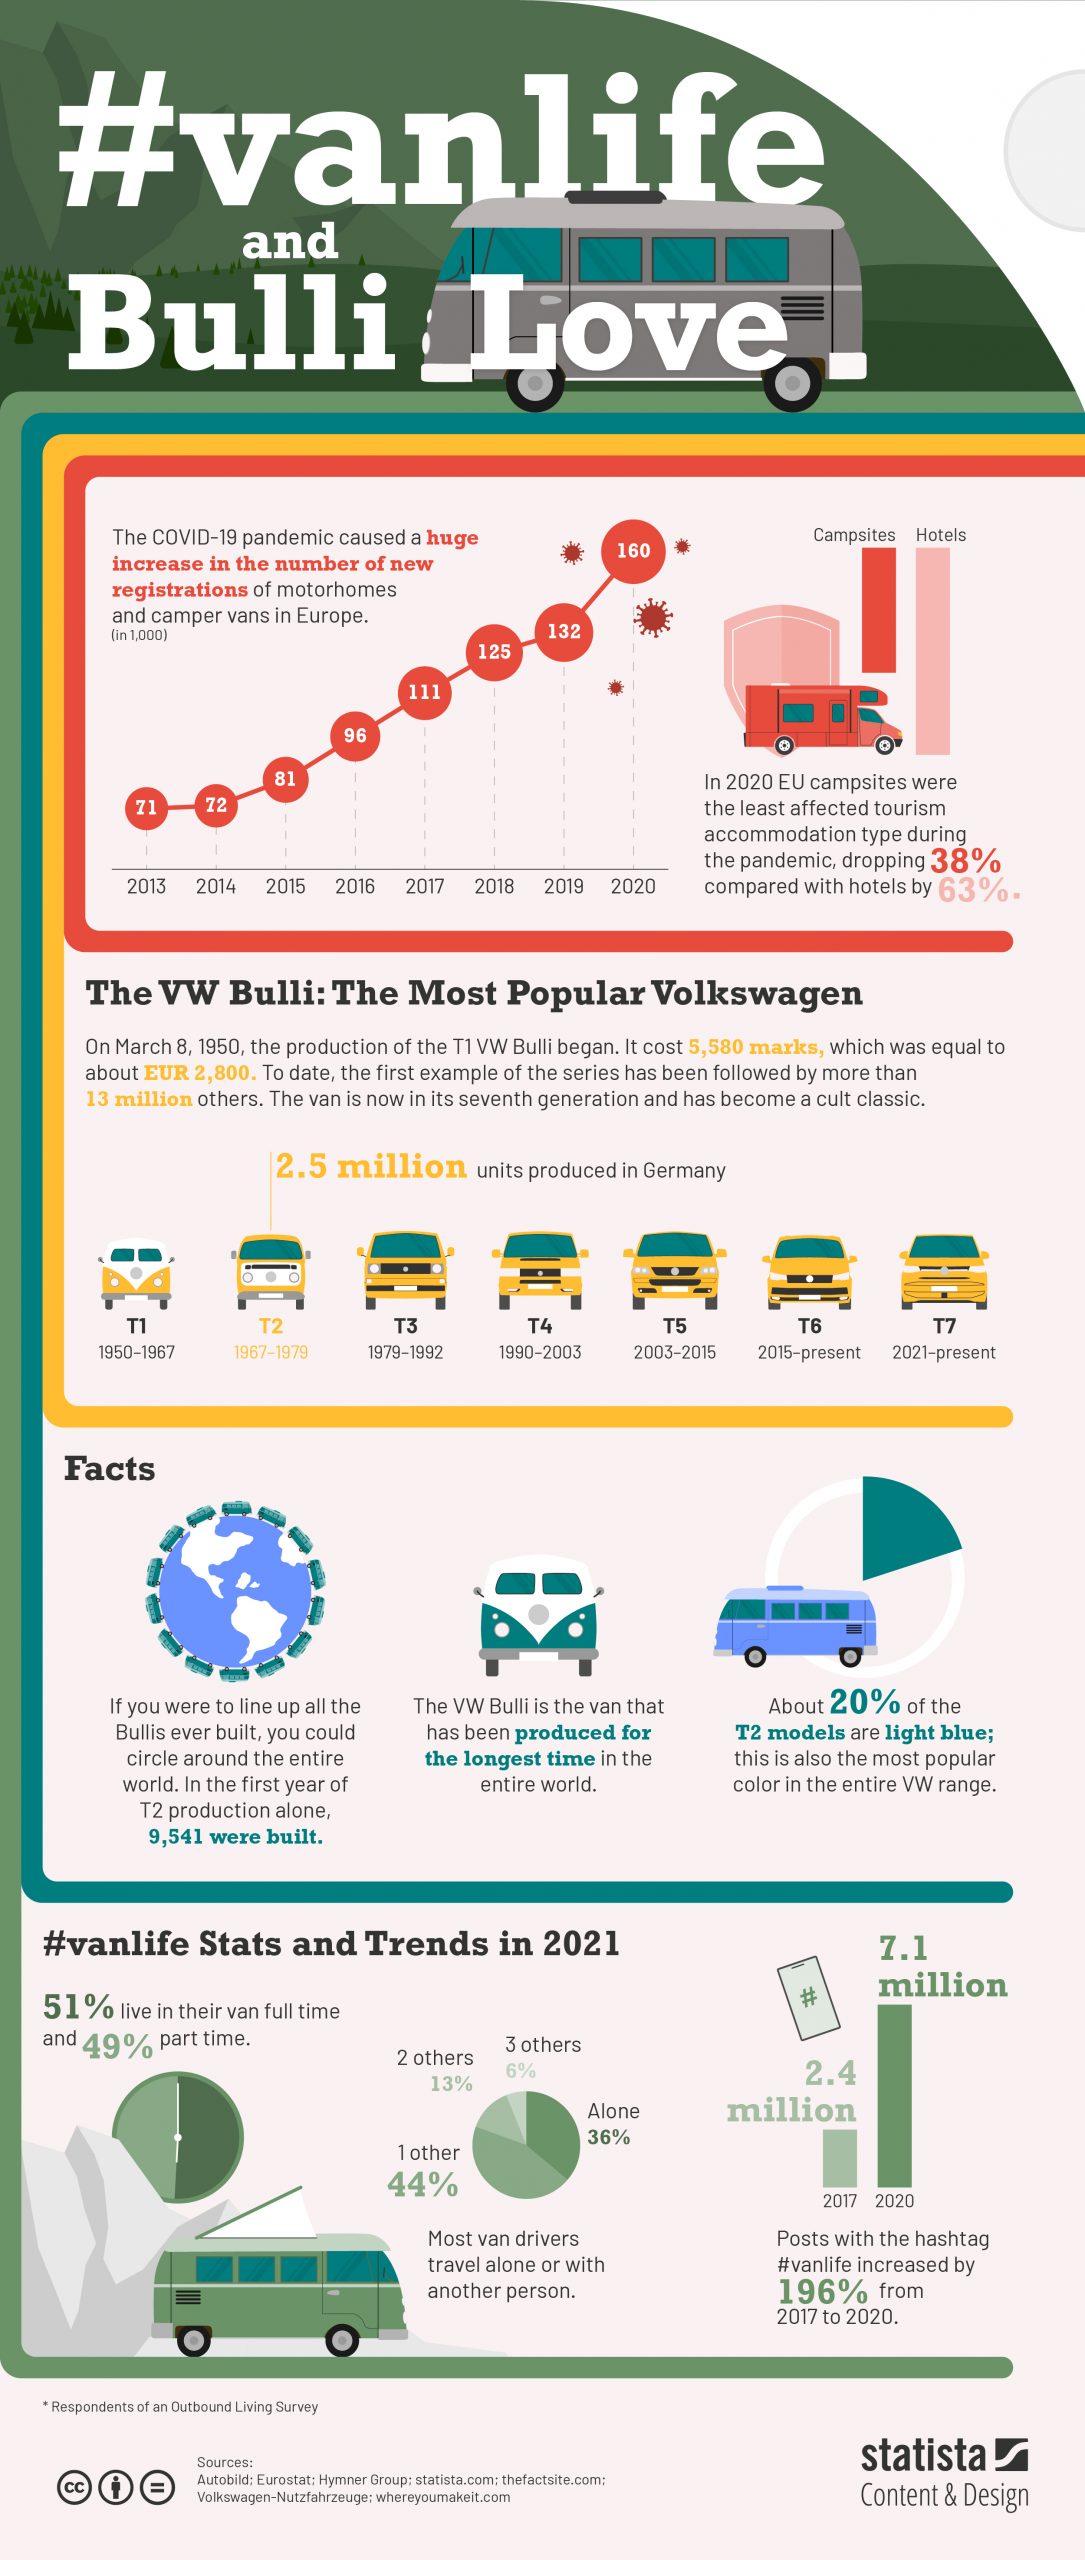
Summer is here and with it comes camping season and outdoor vacations. This time, we dedicate our infographic of the month to the topic of vanlife, which is no longer just a simple term, but a real attitude towards life. Naturally, we had to include dates and facts about the VW cult classic: The Bulli.
Information about current topics and trends as well as free infographics every month in our newsletter!
OUR VALUE ADDED
Individual information design – directly from the expert for data research
We at Statista Content & Information Design have been dealing with data, facts and analyses for years. Therefore we understand particularly well how these can be presented visually. Also, Statista’s portal comprises more than one million statistics, studies and reports from over 22,500 sources – the ideal basis for exciting, customized data storytelling.
our creative services
Discover our products for your individual data visualization
Author: Gabriela Hein
Graphic: Katja Dylla
Date: 10.05.22
The number of insects continues to decline. If not addressed, this development will have fatal consequences for animals, plants, the ecosystem, and humans. To counteract the decline of the insect population, individuals can take action as our infographic of the month shows.
Grasses should not be mowed, trimmed, or stepped on. Plants such as clover and nettles are important food sources for insects.
The so-called early bloomers include snowdrops, daffodils, and crocuses. Insects such as citronella butterflies, ladybugs, and bees, who are active in the early hours of the day, particularly like these flowers.
Wildflowers not only make the garden colorful and eye-catching, they also attract insects. Wildflowers are easy to care for and also provide a place for insects to hibernate during the cold seasons. Some of the most important native wildflowers include ring fern, meadow sage, wild marjoram, and violets.
An herb garden is not only convenient for your own meal planning but is also very tasty for insects. Be it wild garlic, chives, dill, sage, or mint, insects love herbs just as much as people do.
The more native the plants are and the more colorful your garden is, the more attractive it will be to insects.

Information about current topics and trends as well as free infographics every month in our newsletter!
Our value added
Individual information design – directly from the expert for data research
We at Statista Content & Information Design have been dealing with data, facts and analyses for years. Therefore we understand particularly well how these can be presented visually. Also, Statista’s portal comprises more than one million statistics, studies and reports from over 22,500 sources – the ideal basis for exciting, customized data storytelling.
Our creative services
Discover our products for your individual data visualization
Author: Gabriela Hein
Graphic: Sandy Geist
Date: 13.04.2022
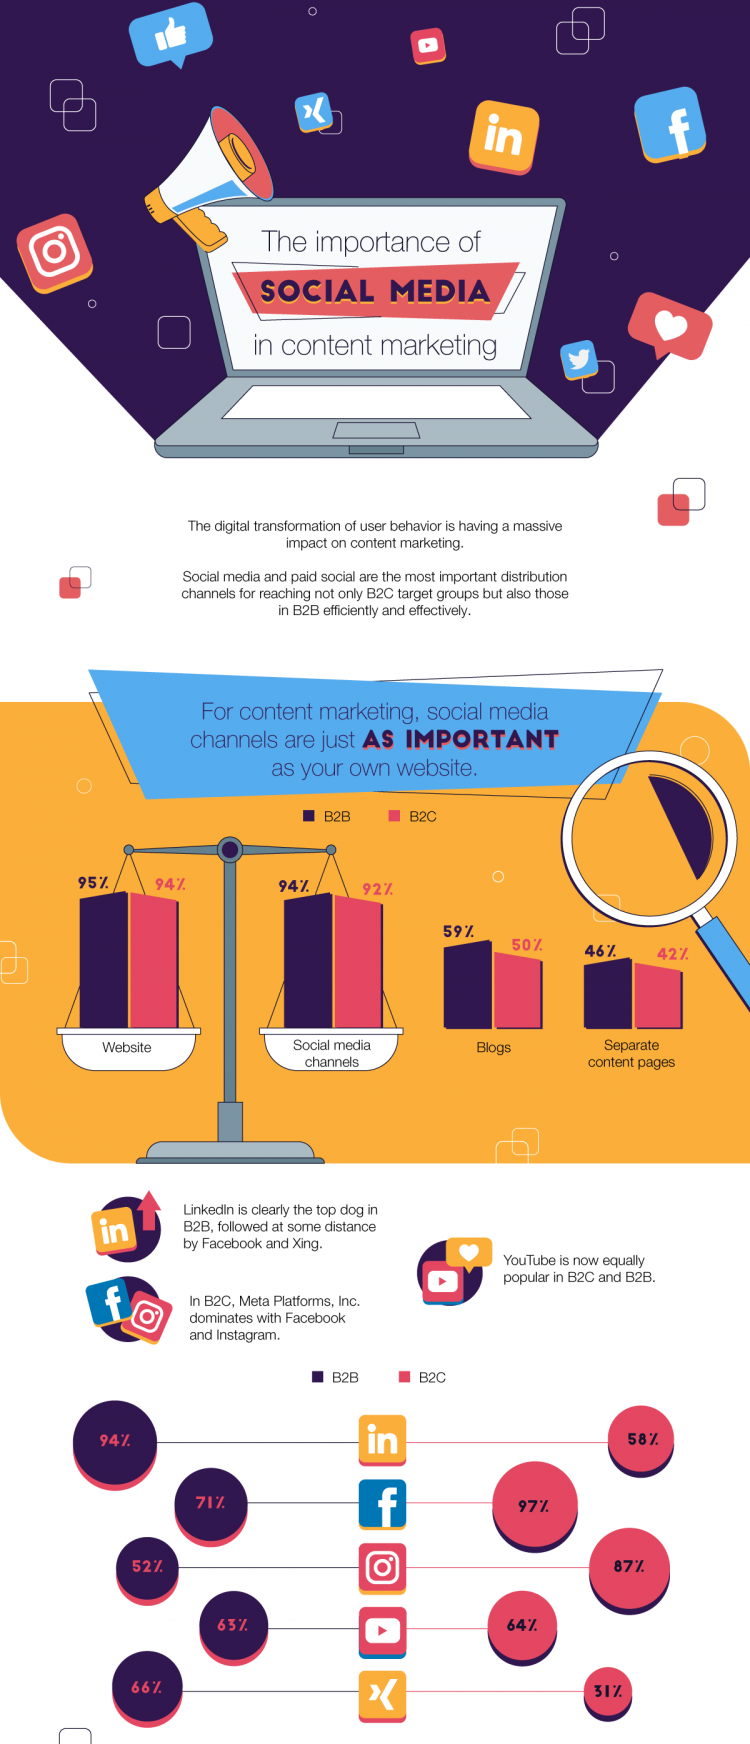
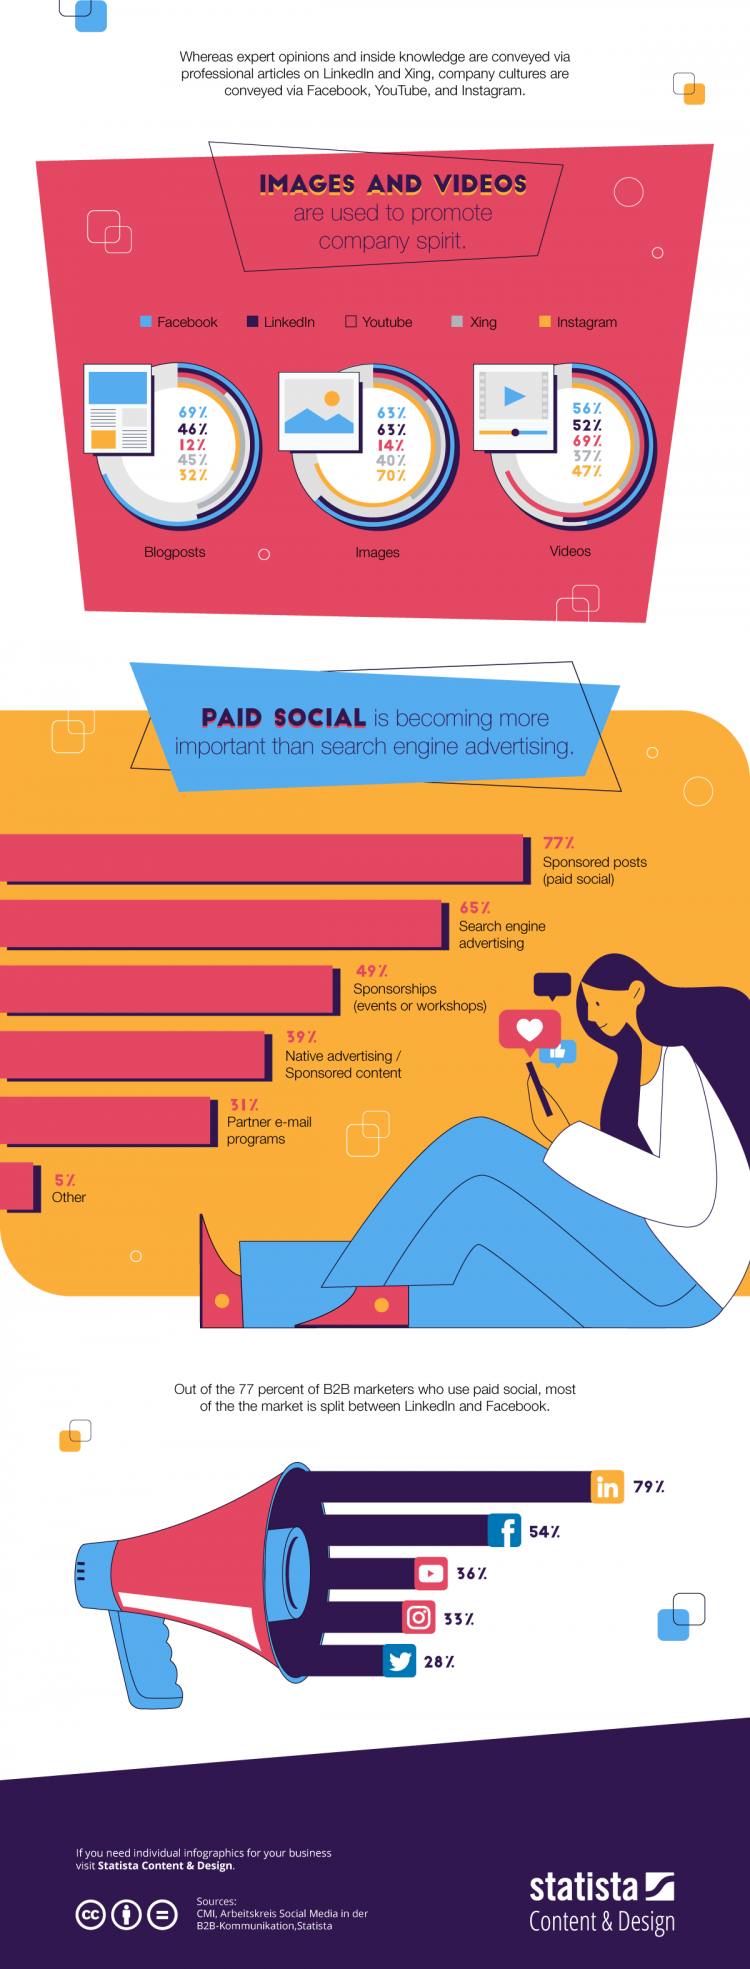
The digital transformation of user behavior is having a massive impact on content
marketing and promoting the rise of social media and paid social as the most important
distribution channels in terms of reaching B2B and B2C target groups efficiently and
effectively.
Our infographic of the month shows how important social media has become in content marketing.
Information about current topics and trends as well as free infographics every month in our newsletter!
OUR VALUE ADDED
Individual information design – directly from the expert for data research
We at Statista Content & Information Design have been dealing with data, facts and analyses for years. Therefore we understand particularly well how these can be presented visually. Also, Statista’s portal comprises more than one million statistics, studies and reports from over 22,500 sources – the ideal basis for exciting, customized data storytelling.
Our Creative services
Discover our products for your individual data visualization
Author: Gabriela Hein
Video: Sander Heremans
Date:. 16.03.22
For two years, the world has been in a state of emergency – one Corona wave after the next, lockdown, contact restrictions, border controls. Many industries are still suffering from the Corona rules. Especially the tourism industry. In our infographic of the month, we show facts and figures on travel behavior during the pandemic, the impact on the aviation industry, and what positive effects restricted travel brings.
In a November 2021 survey by Expedia, 48% of Brits said they plan to travel internationally in the next six months. The French (46%) and Canadians (43%) feel similarly. Only the Australians (40%) and Germans (38%) were still somewhat hesitant.
The fact that travel has become more expensive since the Corona pandemic bothers few: 37% of respondents said they were prepared to pay higher prices. And in keeping with the hashtag #supportyourlocal, 38% were intentional about spending a lot of time in local restaurants and stores. 21% even want to tip more than normal.
The aviation industry has also been hit hard. Many countries closed their borders and closed airports to airlines coming from areas with particularly high incidences. Total passenger kilometers fell by nearly 60% in December 2021 compared to 2019, with Asia-Pacific down -87.5%.
The passenger load factor was around 50% in December 2021. Overall, 69% of international flights were at capacity in 2021.
To save the aviation industry, airlines received enormous amounts of government aid. For example, the Lufthansa Group received aid in the amount of $12.057 billion. Lufthansa repaid the German aid in full in November 2021.
Yes. The countries are enjoying strong growth in domestic tourism. In 2021, 26% of Germans vacationed in their own country. The Baltic Sea was the most popular destination.
In addition, more sustainable tourism ensures that nature can recover. For example, fish were seen again in the canals of Venice or blue skies in parts of China. And reefs in Thailand were also able to heal themselves again.
Information about current topics and trends as well as free infographics every month in our newsletter!
Our value added
Individual information design – directly from the expert for data research
We at Statista Content & Information Design have been dealing with data, facts and analyses for years. Therefore we understand particularly well how these can be presented visually. Also, Statista’s portal comprises more than one million statistics, studies and reports from over 22,500 sources – the ideal basis for exciting, customized data storytelling.
Our Products
Discover our products for your individual data visualization
Author: Gabriela Hein
Video: Maxi Ringlieb
Date: 15.02.22
The 5-day workweek is considered the standard almost everywhere in the world. But there is a growing body of evidence that the 4-day week could be better. As the debate rages on, there is much to be said for a reduction in working hours.
Between 2015 and 2019, the world’s largest experiment of a 4-day week took place in Iceland. 2500 workers took part in total – equivalent to one percent of the country’s population. Instead of 40, they worked only 35 or 36 hours. With the same pay.
The result had been an overwhelming success. In almost all areas, the shorter working hours have had positive effects:
Today, a total of about 86% of the Icelandic working population now has the right to reduced working hours.
A British study found that in an 8-hour-working day, people work only for 2 hours and 53 minutes per day in a truly productive manner. 54% even said they have to distract themselves with private things like social media, job hunting, phone calls, news websites, to make the day bearable.
With a shortened work schedule, there is no time for such things. Work is reorganized so that the same workload can be accomplished in less time. In addition, employees are willing to take fewer breaks in order to have more free time.
As positive as the effects are, however, implementation is also challenging.
The 4-day week is not a no-brainer, because processes have to be adapted to keep the economy running equally well. But it is an enormous gain for everyone’s health, and in many areas, companies can benefit from exactly that. Happy employees, happy economy!
Information about current topics and trends as well as free infographics every month in our newsletter!
Our Value Added
Individual information design – directly from the expert for data research
We at Statista Content & Information Design have been dealing with data, facts and analyses for years. Therefore we understand particularly well how these can be presented visually. Also, Statista’s portal comprises more than one million statistics, studies and reports from over 22,500 sources – the ideal basis for exciting, customized data storytelling.
Our Products
Discover our products for your individual data visualization
Author: Gabriela Hein
Graphic: Katja Schönemann
Date: 11.01.2022
The miracle drug called sport – active exercise is good for your general well-being. And it does much more than just achieving a beach body: dementia prevention, antidepressants, diabetes prevention, and strengthening the immune system are just a few of the positive effects of regular exercise.
There is a wide range of products on offer, and this market is also constantly changing. Here are the latest trends in fitness …
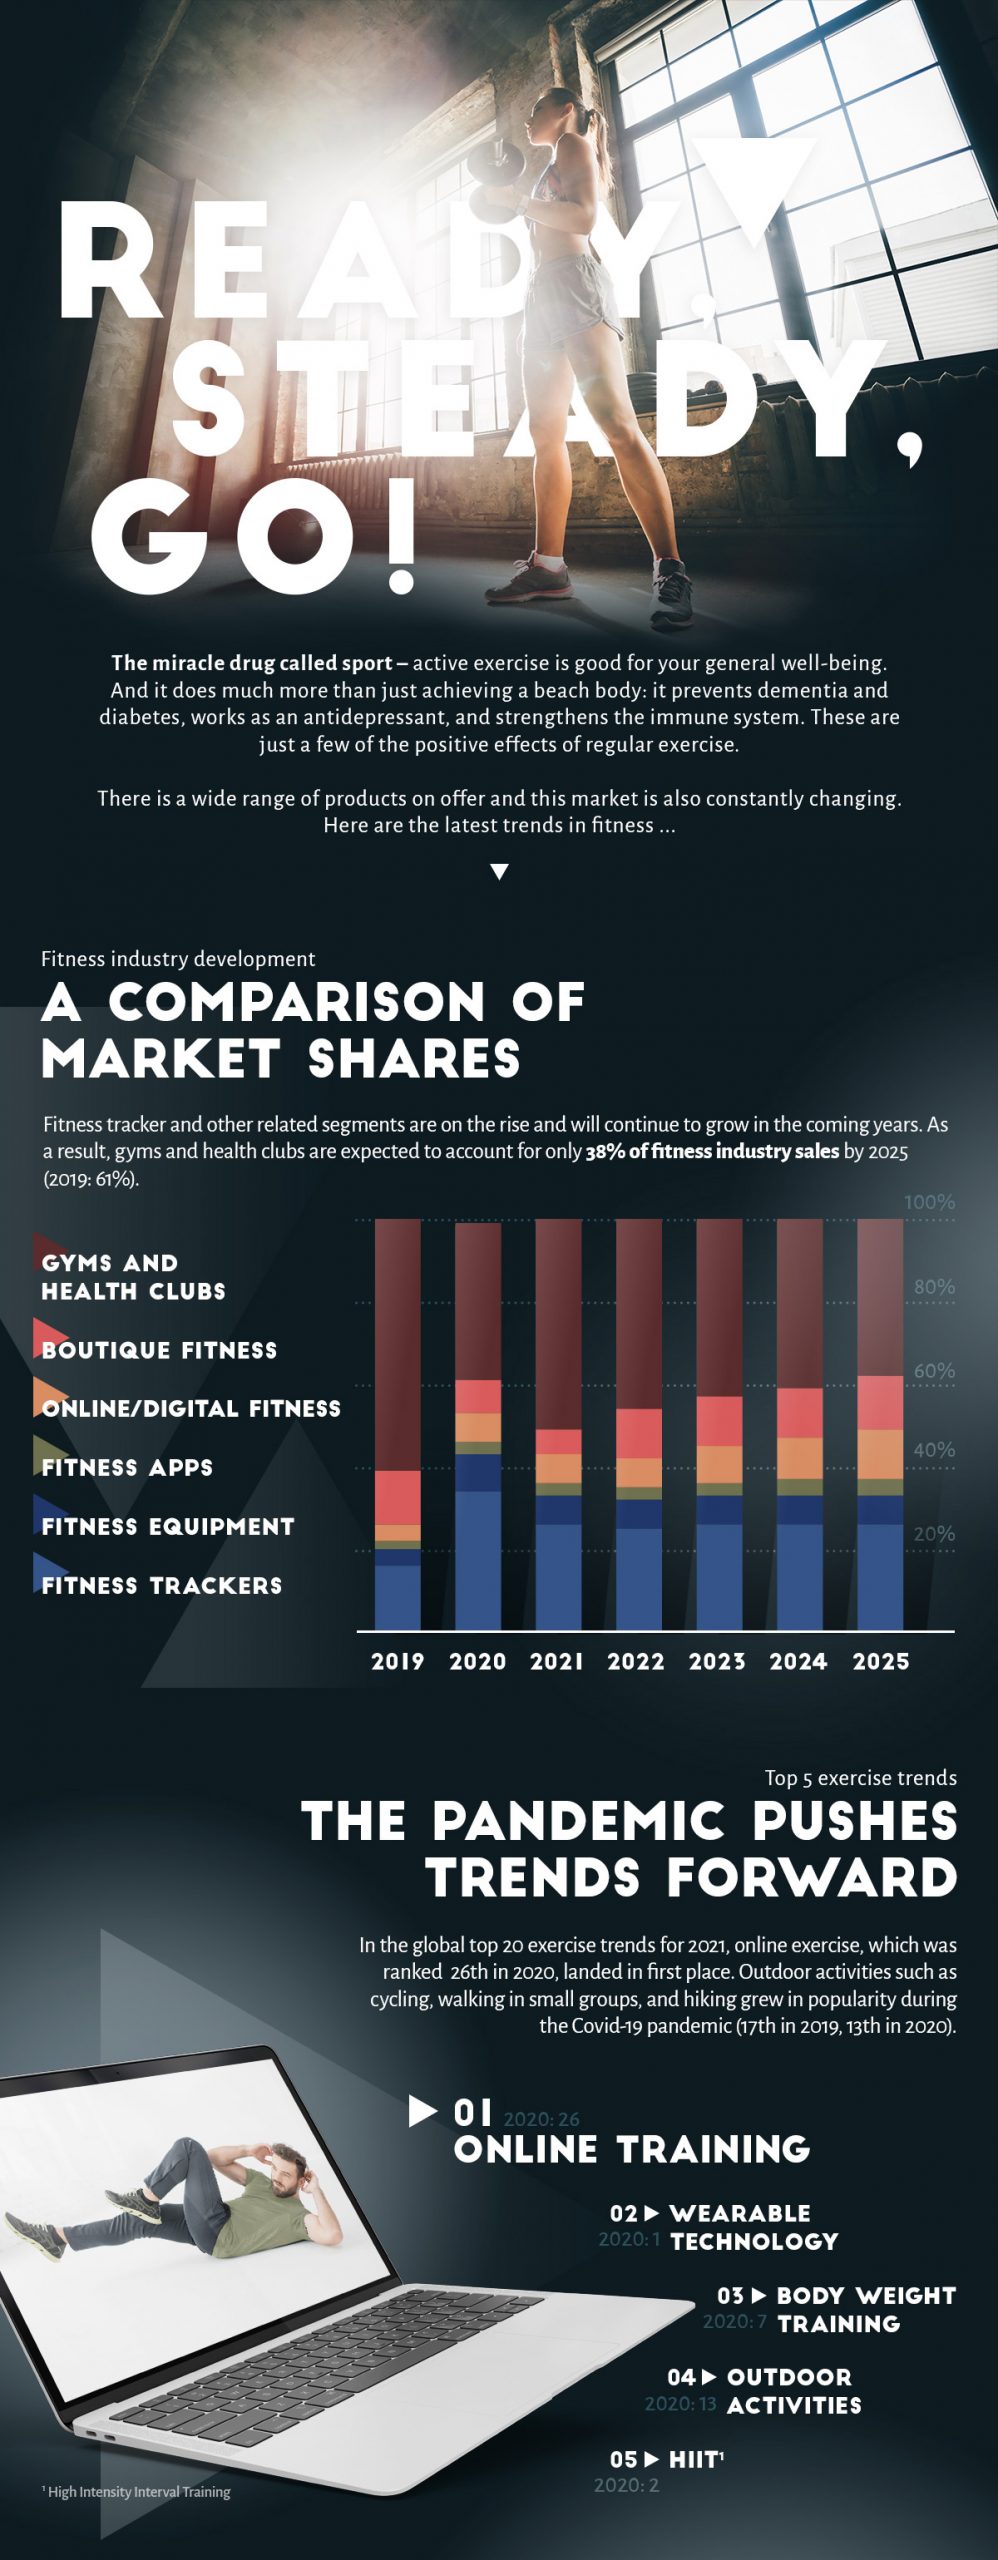

Fitness tracker and other related segments are on the rise and will continue to grow in the coming years. As a result, gyms and health clubs are expected to account for only 38 % of fitness industry sales by 2025 (2019: 61%).
In the global top 20 exercise trends for 2021, online exercise, which was ranked 26th in 2020, landed at No. 1. Outdoor activities such as cycling, walking in small groups, and hiking grew in popularity during the Covid-19 pandemic (17th in 2019, 13th in 2020).
Trail running
Out into nature: Unlike regular jogging, trail running doesn’t involve running on paved paths, but rather up and down hills and over rocks and stones. The different ground conditions make running even more strenuous.
Aerial Yoga
Yoga fans take note: With Aerial Yoga, you float in the air and can perform poses that are otherwise too difficult. This trendy sport relaxes soul and mind, trains balance and releases tension.
E-Mountain biking
E-mountain biking is a perfect way to explore nature and areas that are difficult to reach on foot or by bike.
In 2021, around 29.4 million Germans reported that they exercise several times a week or a month. 41.1 million exercise only once a month, rarely and never, or did not specify. We think there’s still room for improvement!
Information about current topics and trends as well as free infographics every month in our newsletter!
OUR VALUE ADDED
Individual information design – directly from the expert for data research
We at Statista Content & Information Design have been dealing with data, facts and analyses for years. Therefore we understand particularly well how these can be presented visually. Also, Statista’s portal comprises more than one million statistics, studies and reports from over 22,500 sources – the ideal basis for exciting, customized data storytelling.
Our Products
Discover our products for your individual data visualization
Author: Gabriela Hein
Graphic: Camila Quiroz
Date: 14.12.2021
Did you know that Statista now has over 1,200 employees from 57 nations? Or that the Christmas tree at the Rockefeller Center in New York is lit up by over 5,000 lights? In our last infographic of the month for 2021, we have something very special for you: facts and figures about Statista and Christmas at our locations worldwide. We wish you a successful end to the year and a merry Christmas!

Information about current topics and trends as well as free infographics every month in our newsletter!
OUR VALUE ADDED
Individual information design – directly from the expert for data research
We at Statista Content & Information Design have been dealing with data, facts and analyses for years. Therefore we understand particularly well how these can be presented visually. Also, Statista’s portal comprises more than one million statistics, studies and reports from over 22,500 sources – the ideal basis for exciting, customized data storytelling.
Our Products
Discover our products for your individual data visualization
Author: Gabriela Hein
Graphic: Anne Geick
Date: 5th November 2021
Soon the bargain hunt for the unbeatable Black Friday offers will start again. This month, we have taken a closer look at the topic and prepared exciting facts and figures about Black Friday for the infographic of the month.
On Your Mark, Get Set, Shop!
Black Friday marks the start of the Christmas shopping period in the US and takes place on the fourth Friday in November, after Thanksgiving. The following Monday – Cyber Monday – kicks off online shopping for the holidays.
Bargain Hunting
Half of all Americans are planning to make an online purchase on Black Friday and Cyber Monday.
Around a third of Germans are planning to do the same. 22% of Americans, 11% of Germans, and 15% of those in the UK are planning to shop in-store.
Holiday Sales
In 2020, around USD 10.84 billion was spent in the US on Cyber Monday. On Black Friday, online sales reached USD 9.03 billion – almost twice as much as in 2017 (USD 5.03 billion).
Amazon – The Champion of Black Fridays
25% of Amazon dealers say that Black Friday in 2020 generated the most sales. Prime Day came in second place with 17%.
The COVID-19 pandemic has once again increased willingness to make a purchase online and from home. Between Black Friday and Cyber Monday, sales made by third parties on Amazon
reached a record USD 4.8 billion in 2020. That’s an increase of 60% in comparison to 2019!

Information about current topics and trends as well as free infographics every month in our newsletter!
Our value added
Individual information design – directly from the expert for data research
We at Statista Content & Information Design have been dealing with data, facts and analyses for years. Therefore we understand particularly well how these can be presented visually. Also, Statista’s portal comprises more than one million statistics, studies and reports from over 22,500 sources – the ideal basis for exciting, customized data storytelling.
Our Products
Discover our products for your individual data visualization
Author: Gabriela Hein
Graphic: Jörg Huylebrouck
Date: 19th October 2021
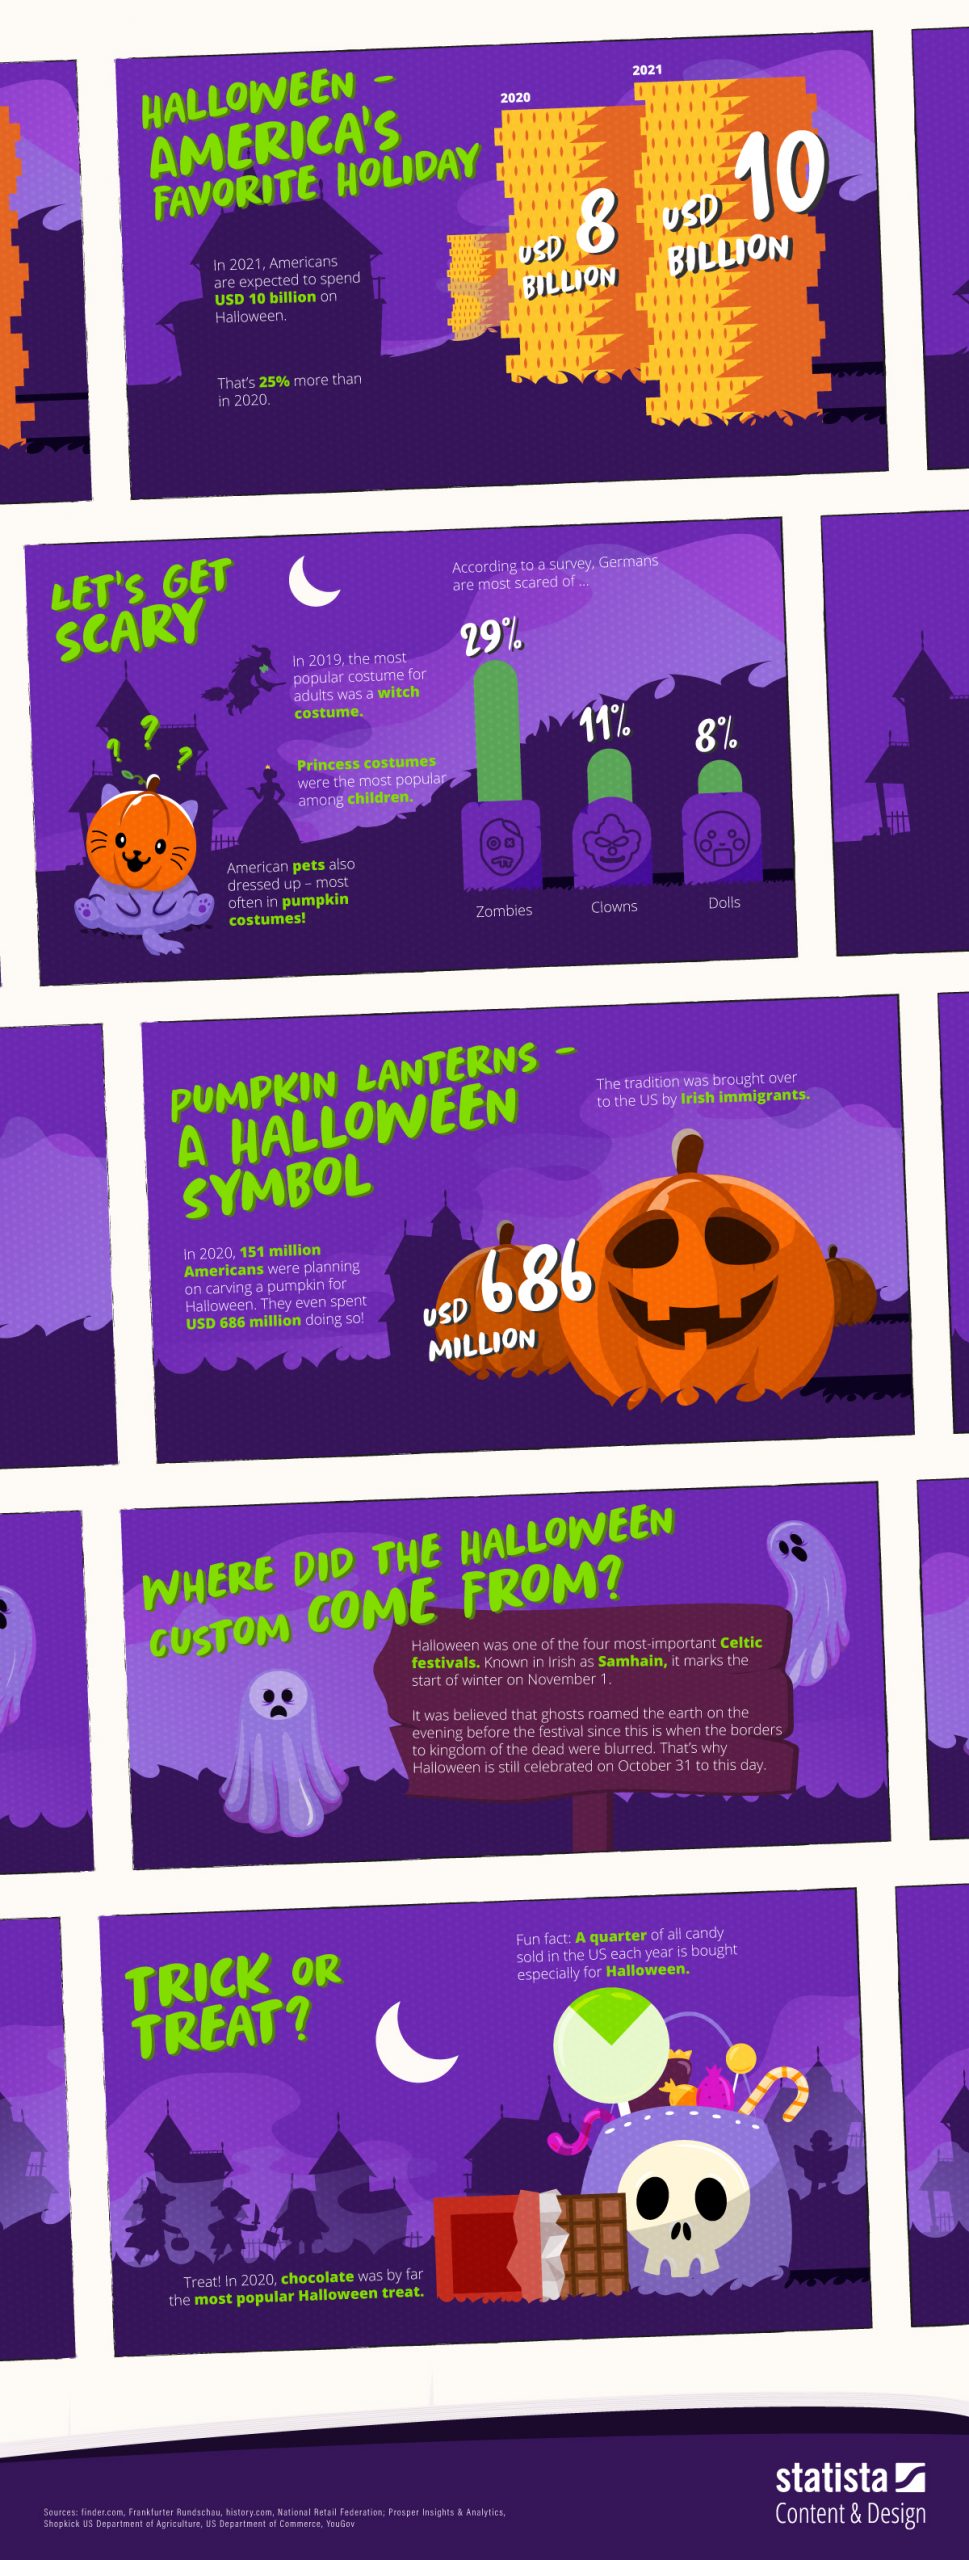
After the COVID-19 pandemic made it necessary to restrict Halloween celebrations in 2020, Americans are looking forward to having a blast this year. And they are ready to shop until they drop:
According to the National Retail Federation, it is projected that U.S.-Americans will spend USD 10 billion on the Halloween season. Compared to 2020 (USD 8 billion), this represents a clear increase.
Nowhere else in the world is so much dedication and emphasis invested in decorating houses and front yards than in the U.S.A. But not only do Americans give their homes a makeover with spooky paraphernalia, they themselves love to dress up in costumes.
The most popular costume in 2019 for adults were witches, vampires, and superheroes. Children loved to dress up as princesses, superheroes, or Spider-Man. And to make sure that every family member was in the Halloween spirit, dogs and cats were most frequently dressed up in pumpkin costumes by Americans.
No entryway is complete without the famous pumpkin face — the jack-o’-lantern. Last year, a survey indicated that 151 million Americans intended to carve pumpkins and spent approximately US$686 million on this activity. That is nearly twice as much as in 2019 (US$377 million). The tradition of the jack-o’-lantern can be traced back to Irish immigrants, who took it to the U.S.A. and expanded upon it there.
Halloween was one of the four most important Celtic festivals and had its beginnings more than 2000 years ago. Called “Samhain” in Irish, it marked the beginning of winter on November 1.
It was believed that on the eve of the festival, spirits walked the earth because the border with the realm of the dead blurred that night. Before going to bed, people lit fires in their kitchens and prepared food for the ancestors in case they came back. Because of this and to this day, Halloween is celebrated on October 31. The name Halloween evolved from the designation for the day before All Saints’ Day: All Hallows’ Eve.
Trick! By far, chocolate was the most popular Halloween candy. This was followed by gummy bears, caramels, and lollipops. And did you know that one-quarter of all candy sold in the U.S.A. is purchased for Halloween?
Happy Halloween!
Information about current topics and trends as well as free infographics every month in our newsletter!
Our value added
Individual information design – directly from the expert for data research
We at Statista Content & Information Design have been dealing with data, facts and analyses for years. Therefore we understand particularly well how these can be presented visually. Also, Statista’s portal comprises more than one million statistics, studies and reports from over 22,500 sources – the ideal basis for exciting, customized data storytelling.
Our Products
Discover our products for your individual data visualization
Author: Gabriela Hein
Graphic: Valerio Salinitro
Date: 14th September 2021
This August and September, many schools around the world have been opening their doors again after the long summer holidays. So, what better time than now for an infographic all about school?
First of all: good news! The total number of elementary school students worldwide has increased in recent years. In 2000, approximately 657 million children were enrolled in elementary education. Almost 20 years later, in 2019, this figure amounted to about 739 million. The highest recorded figure to date was 742 million in 2017. During this same time period, an increasing number of students graduated from elementary school, with the graduation rate totaling almost 90 percent in 2019.
The first day of school is special and exciting, both for the child and their parents, and it is a celebrated day in many countries. As such, first-day rituals are not to be missed.
When people enter the world of employment and realize how limited their vacation days are, it can often feel like students are constantly on vacation. In some ways, this is actually true: In 2020, students in Germany had an average of 13.15 weeks of vacation out of 53 weeks that year.
… the world’s smallest school is found in Alpette, Italy, and has only one student and one teacher?
… the world’s largest school is located in India and has approximately 51,000 students and 2,500 teachers?
… Australia’s “Schools of the Air” for children based in rural communities have been in operation for 70 years, first broadcast via radio, lessons now take place online.

Information about current topics and trends as well as free infographics every month in our newsletter!
Our value added
Individual information design – directly from the expert for data research
We at Statista Content & Information Design have been dealing with data, facts and analyses for years. Therefore we understand particularly well how these can be presented visually. Also, Statista’s portal comprises more than one million statistics, studies and reports from over 22,500 sources – the ideal basis for exciting, customized data storytelling.
Our Products
Discover our products for your individual data visualization
You need to load content from reCAPTCHA to submit the form. Please note that doing so will share data with third-party providers.
More Information