infographic of the month – August 2021


Navigation

Author: Gabriela Hein
Video: Sander Heremans
Date: August 09, 2021
The fact that we Germans love our beer is no surprise. But do we come out on top in a country comparison? Where is the highest per-capita consumption of beer and why has craft beer become so popular? We will explain all of this. Cheers! Prost! Na Zdrowie! Skål!
The first question as to whether Germany comes out on top in terms of its beer consumption can be answered with a resounding YES. And by a wide margin! In 2019, 82,933 hectoliters (hl) of beer were consumed in Germany. In second place is the United Kingdom with just 47,119 hl. In addition, further important markets for beer in Europe are Spain (41,301 hl) and Poland (37,949 hl).
When comparing per-capita consumption of beer, however, we get a different picture: The Czechs consumed an average of 142 liters per capita in 2019, making them the biggest beer drinkers in Europe!
People are also big beer drinkers in:
But where do our Belgian friends rank? After all they are well known for their love of beer. To the great surprise of our senior motion designer Sander Heremans, who is Belgian and designed the video, Belgians are only ranked in 19th place. With a per-capita consumption of 68 liters, this is behind Hungary (70 l) and Luxembourg (69 l).
However, beer is no longer just a classic Pilsner or Hefeweizen. Craft beer, which is available in a wide variety of flavors, has become more and more popular in the last few years.
In 2010, there were only 1,749 craft breweries in the U.S. Just five years later, the number doubled, and in 2020 there were already just under 9,000 craft breweries in the U.S. And craft beer does not just have a great taste, but it has also created many jobs: Around 400,000 people work in the craft beer ndustry, which generated revenues of 62.1 billion dollars in 2020.
The most popular varieties and flavors are:
And what is more: Beer is not just good for your bones because of its high silicon content, but it can also make you happy! At the University of Indiana, researchers discovered that it was not the alcohol but rather the taste of beer that made people happy. Whilst the participants were drinking, the happy hormone dopamine was released. Since they only drank a very small amount, alcohol can be excluded as a cause. In other words: Non-alcoholic beer can also make you happy.
Information about current topics and trends as well as free infographics every month in our newsletter!
OUR VALUE ADDED
Individual information design – directly from the expert for data research
We at Statista Content & Information Design have been dealing with data, facts and analyses for years. Therefore we understand particularly well how these can be presented visually. Also, Statista’s portal comprises more than one million statistics, studies and reports from over 22,500 sources – the ideal basis for exciting, customized data storytelling.
Author: Christopher Ledsham
Graphic: Canny Sutanto
Date: July 13, 2021
Whether reading the morning paper with a coffee, tuning in to watch the 6 o’clock bulletin, or scrolling through social feeds for the latest sports and weather updates, news consumption is an integral part of daily life. TV remains the preferred medium among Europeans in 2021, although those using social media for regular news consumption has risen to 52% from just 20% in 2011.
As the media landscape continues to shift, people worldwide are evaluating the sources they consider to be trustworthy. With increasing numbers of readers turning their attention online, the authority of well-established newspapers and magazines is being challenged throughout the continent. The Netherlands ranks first with 80% of respondents saying they trust print media, compared to just 24% in Slovenia.
Although news articles are still available over the internet for free, an increasing number of media outlets are placing some or all of their online content behind “paywalls”, making them accessible to paid subscribers only. Despite the English-language content of most popular subscription media outlets, just 7% of UK consumers paid for news in 2020, compared to 42% of Norwegians and 27% of Swedes.

Information about current topics and trends as well as free infographics every month in our newsletter!
OUR VALUE ADDED
Individual information design – directly from the expert for data research
We at Statista Content & Information Design have been dealing with data, facts and analyses for years. Therefore we understand particularly well how these can be presented visually. Also, Statista’s portal comprises more than one million statistics, studies and reports from over 22,500 sources – the ideal basis for exciting, customized data storytelling.
Author: Sandra Fischer
Video: Dun Lewis
Date: June 16, 2021
June is finally upon us, temperatures are rising, and people are starting to line up as ice cream vans roam the streets again. What would summer be without ice cream? This month, we have put together an animated video full of facts and figures about summer’s most popular refreshment. Did you know, for example, that the average German consumed over 4 kg of ice cream last year – a figure that would make Belgians smirk!
Our Senior Motion Designer Dun Lewis likes to keep his freezer at home topped up with ice cream, preferably white chocolate with caramel. Nevertheless, the wide variety of ice cream parlors that open in summer can be both a blessing and a curse – especially when being confronted with other people’s tasty-looking choices …
Information about current topics and trends as well as free infographics every month in our newsletter!
OUR VALUE ADDED
Individual information design – directly from the expert for data research
We at Statista Content & Information Design have been dealing with data, facts and analyses for years. Therefore we understand particularly well how these can be presented visually. Also, Statista’s portal comprises more than one million statistics, studies and reports from over 22,500 sources – the ideal basis for exciting, customized data storytelling.
Author: Johannes Laakmann
Date: Mai 10, 2021
In 2011 just under a third of companies used cloud computing. By 2019, however, 76% of German companies had implemented cloud computing services. Cloud services have proved to be extremely advantageous for technology companies. At Amazon they represent 12% of all revenue, for example. It is estimated that nearly half of all company data worldwide is now stored in the cloud. In our latest infographic we examine the staggering growth of cloud services and how they might develop in future.

Information about current topics and trends as well as free infographics every month in our newsletter!
OUR VALUE ADDED
Individual information design – directly from the expert for data research
We at Statista Content & Information Design have been dealing with data, facts and analyses for years. Therefore we understand particularly well how these can be presented visually. Also, Statista’s portal comprises more than one million statistics, studies and reports from over 22,500 sources – the ideal basis for exciting, customized data storytelling.
Author: Sarah Tebbe
Date: April 12, 2021
When it comes to equality, some progress has been made already but there is still a long way to go – the statistics prove that. However, these statistics usually reflect the situation in the same successful industrialised nations. What is happening in countries that aren’t normally the subject of media focus? In the following infographic, we take a look at equality in Italy, Brazil, Malaysia, South Africa and Hungary.

Information about current topics and trends as well as free infographics every month in our newsletter!
OUR VALUE ADDED
Individual information design – directly from the expert for data research
We at Statista Content & Information Design have been dealing with data, facts and analyses for years. Therefore we understand particularly well how these can be presented visually. Also, Statista’s portal comprises more than one million statistics, studies and reports from over 22,500 sources – the ideal basis for exciting, customized data storytelling.
Author: Sandra Fischer
Date: March 12, 2021
The urban gardening trend is making our cities ever greener. Be it rooftops, courtyards, or balconies, you don’t have to live in the countryside to grow flowers, fruit, or vegetables. This month, our colorful infographic provides tips and tricks for gardening in smaller spaces – just in time for spring! The roof garden of the Paris Expo Porte de Versailles shows urban gardening works on a larger scale too.
Our Senior Art Director, Katja Dylla, is an avid gardener. She loves spending time in her 80 m2 allotment in Hamburg where she grows her own vegetables and bee-friendly flowers. Her passion for all things green really comes across in this infographic!
")
Information about current topics and trends as well as free infographics every month in our newsletter!
OUR VALUE ADDED
Individual information design – directly from the expert for data research
We at Statista Content & Information Design have been dealing with data, facts and analyses for years. Therefore we understand particularly well how these can be presented visually. Also, Statista’s portal comprises more than one million statistics, studies and reports from over 22,500 sources – the ideal basis for exciting, customized data storytelling.
Author: Yannic Stock
Date: Feb 12, 2021
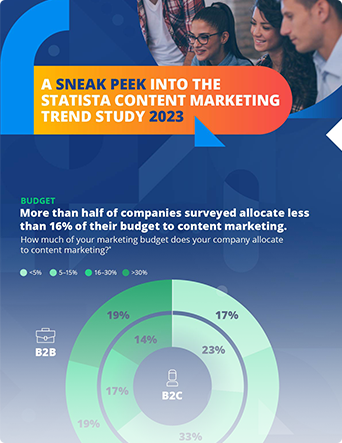
For large companies in particular, content marketing is no longer just a smart strategy, but has in fact become a necessity. In order to help your brand and message stand out amidst the daily overload of information, it is essential to not only produce attractive, well-placed ad posts, but also ensure that they feature good content tailored to the respective target group.
Our infographic of the month for February is therefore dedicated to exciting data drawn from our Statista Content Marketing Compass 2021, which compiles the most important and interesting findings from the field in one comprehensive report.
The key element that content requires, however, is creativity! Our Art Director Katja Schönemann accordingly gave her imagination free reign when it came to designing the infographic. Using donuts, smarties and soda bottles she arranged and photographed herself, she created pie and bar charts that can’t be overlooked in even the most crowded of newsfeeds!


Information about current topics and trends as well as free infographics every month in our newsletter!
OUR VALUE ADDED
Individual information design – directly from the expert for data research
We at Statista Content & Information Design have been dealing with data, facts and analyses for years. Therefore we understand particularly well how these can be presented visually. Also, Statista’s portal comprises more than one million statistics, studies and reports from over 22,500 sources – the ideal basis for exciting, customized data storytelling.
Author: Yannic Stock
Date: Jan 21, 2021
There will be lots of changes for EU citizens in 2021 – both on a large and small scale. For example, as of July, we will be saying goodbye to plastic, banning the manufacture of plastic cotton buds, cutlery, plates and straws and polystyrene single-use drinks and food packaging throughout the whole of the EU.
Before this, a new regulation on energy-efficiency labels will come into effect. As of March, large electrical appliances such as refrigerators and televisions will not be awarded any energy-efficiency class higher than A – in fact, only a few appliances that are currently manufactured will be given a better class than B. The new category A should be reserved for new, even more efficient appliances.
In addition to EU-wide changes, 2021 will offer great potential for change for citizens in five member states: this is due to the national elections being held in the Netherlands, Cyprus, Bulgaria, the Czech Republic and Germany. Many are particularly anticipating the election in Germany, since Angela Merkel will no longer be in office after holding the post of federal chancellor for 16 years – irrespective of the result, the election will bring about a change in leadership.
Our Art Director, Isabell Küpper, has created an infographic in a colourful retro style on each of the three topics. Bold colours and amusing illustrations attract attention and ensure that the message behind the design is conveyed.


Information about current topics and trends as well as free infographics every month in our newsletter!
OUR VALUE ADDED
Individual information design – directly from the expert for data research
We at Statista Content & Information Design have been dealing with data, facts and analyses for years. Therefore we understand particularly well how these can be presented visually. Also, Statista’s portal comprises more than one million statistics, studies and reports from over 22,500 sources – the ideal basis for exciting, customized data storytelling.
Author: Yannic Stock
Date: Dec 16, 2020
Christmas may not have escaped the clutches of the coronavirus pandemic this year but that hasn’t stopped swathes of people from getting in the holiday spirit. As this month’s infographic shows, one in two people confess to looking forward to Christmas just as much as usual – despite the numerous restrictions preventing customary celebrations.
For many people, the focus is on spending time with family – even if this means new potential for conflict. 24% have first-hand experience of (pre-)Christmas family squabbles. Partners and parents represent particularly acute points of friction, while mealtimes can also lead to heated discussions.
In much of both the UK and Germany, many households keep things traditional: 45% of Germans simply serve sausages and potato salad, while an impressive 64% of Britons take on the daunting task of preparing turkey. What both countries have in common, however, is plenty of alcohol! While others are feasting, the Finns choose to relax with a Christmas sauna.
Despite Christmas being the season of love, togetherness is often neglected during the holidays. Part of this could be because the atmosphere is often somewhat unsexy. One in five people reported that sleeping in their old childhood bedroom was a mood-killer, while a third admitted that overeating makes them feel too sluggish to get “in the mood”.
Our Art Director Canny Sutanto created lovely illustrations for our infographic to support and enhance the data points, while also bringing its entertaining characteristics to life. From the fights at the dinner table to the Christmas sweater and the Finnish sauna elf, each drawing has been lovingly rendered in great detail and warm colors.

Information about current topics and trends as well as free infographics every month in our newsletter!
OUR VALUE ADDED
Individual information design – directly from the expert for data research
We at Statista Content & Information Design have been dealing with data, facts and analyses for years. Therefore we understand particularly well how these can be presented visually. Also, Statista’s portal comprises more than one million statistics, studies and reports from over 22,500 sources – the ideal basis for exciting, customized data storytelling.
Author: Yannic Stock
Date: 02.11.2020
When there’s a presidential election in the US, it’s just as certain to dominate the news in Europe. The question is always: will it be a Democrat or a Republican in the White House? After all, since 1853 no candidate from any other party has had a serious chance of becoming president. Since then, 19 Republican and 16 Democratic candidates have made it to the White House (as of 2 November 2020).
Abraham Lincoln remains the most popular US president in history. The first Republican president represents not only the end of the Civil War, but also the abolition of slavery. Other popular figures are the charismatic John F. Kennedy and the founding father himself, George Washington.
Tragically, the two most popular presidents – Lincoln and Kennedy – were assassinated before the end of their respective terms. James A. Garfield and William McKinley sadly also suffered the same fate. Throughout history others have also come close to losing their office, albeit for political reasons.
Designer Anne Geick chose the US colours of red, white and blue for this infographic, using a line-style to illustrate the White House and famous faces of Lincoln, Kennedy, Washington, Roosevelt (Teddy) and Jefferson.

Information about current topics and trends as well as free infographics every month in our newsletter!
OUR VALUE ADDED
Individual information design – directly from the expert for data research
We at Statista Content & Information Design have been dealing with data, facts and analyses for years. Therefore we understand particularly well how these can be presented visually. Also, Statista’s portal comprises more than one million statistics, studies and reports from over 22,500 sources – the ideal basis for exciting, customized data storytelling.
You need to load content from reCAPTCHA to submit the form. Please note that doing so will share data with third-party providers.
More Information