Author: Nicole Turkin
Graphic: Katja Schönemann
Datum: 15.08.22
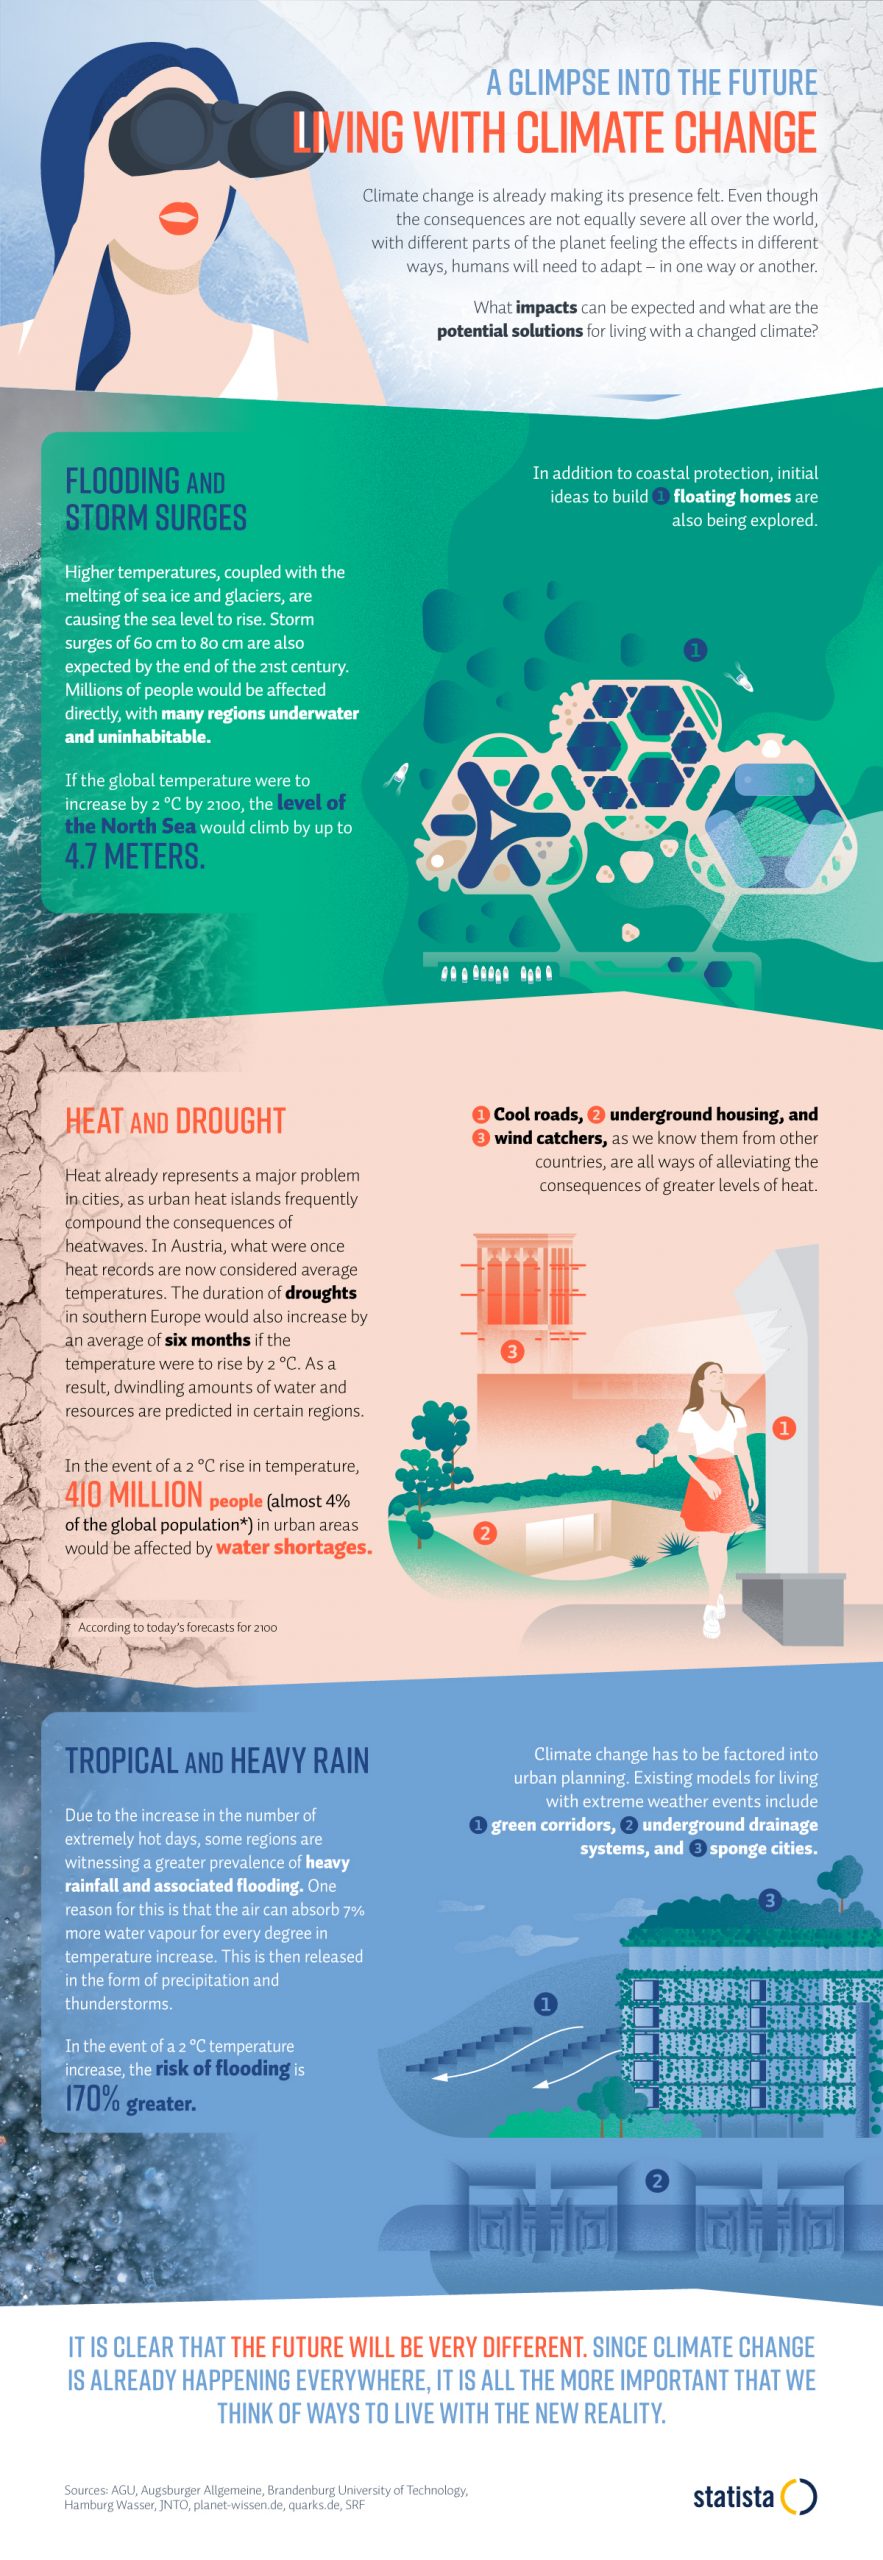
Heatwaves, flooding, heavy rain – the impact of climate change can already be felt around the world. We are facing existential challenges that will fundamentally change our way of life. But what solutions are out there in terms of adapting to climate change? In this month’s featured infographic, we present some innovative approaches.

Information about current topics and trends as well as free infographics every month in our newsletter!
OUR VALUE ADDED
Individual information design – directly from the expert for data research
We at Statista Content & Information Design have been dealing with data, facts and analyses for years. Therefore we understand particularly well how these can be presented visually. Also, Statista’s portal comprises more than one million statistics, studies and reports from over 22,500 sources – the ideal basis for exciting, customized data storytelling.
our creative services
Discover our products for your individual data visualization
You need to load content from reCAPTCHA to submit the form. Please note that doing so will share data with third-party providers.
More Information